Introduction of Computer Graphics
By Notes Vandar
Early History:
The first computer graphics design system was developed by Evan Sutherland as his Ph.D. thesis at MIT in 1963. It was called Sketchpad and allowed a user to sketch a mechanical part on a computer screen, place constraints on the part, and have the computer calculate the exact design of the part. It was revolutionary and computer graphics took off “as a thing” from that time forward.
In the early days, if you wanted to create computer graphics you had to write programs that directly talked to the graphics hardware. As new hardware designs were created, the software had to be completely rewritten to work with the new hardware. Throughout the 1970’s many “graphics libraries” were created to solve this problem, but most of the libraries worked with individual operating systems and could not be easily ported to new operating systems or new hardware. In the 1980’s the ISO (International Organization for Standardization) attempted to create a standard computer graphics library called PHIGS. It was claimed to be the best and final answer for creating computer graphics across all computing platforms. However, it was a complete failure for one simple reason: not only did PHIGS provide a library of functions for drawing 3D graphics, but it also specified exactly how you had to store and organize your graphics data. Programmers hated it.
Computer graphic research continues still today around the world. Companies such as Industrial Light and Magic by George Lucas are regularly refining cutting-edge computer graphic technology to present the world with a new manufactured digital reality.
- 1940-1941: The first directly digital computer-generated graphics that would associate with today as being actual CG. The very first radiosity image was invented at MIT in the 1940s.
- 1946: The images were first presented at the 1946 national technical conference of the Illuminating Engineering Society of North America. 1948: The images were published in the book: Lighting Design by Moon and D. E. Spencer.
- 1950: John Whitney Sr. invents his computer-assisted mechanisms to create some of his graphic artwork and short films.
- 1951: Vector scope computer graphics display on the computer at MIT.
- The General Motors Research Laboratory also begins the study of computer-aided graphical design applications.
- 1955: Sage system uses the first light pen as an input device at MIT Lab by Bert Sutherland.
- 1956: Lawrence Livermore labs associate graphics display with IBM 704 and film recorder for color images.
- Bertram Herzog uses analog computers to create CRT graphics in the behavior of military vehicles at the University of Michigan computing center.
- 1957: In the National Bureau of Standards first image-processed photo was used.
- The IBM 740 created a sequence of points on a CRT monitor to represent lines and shapes.
- 1958: Steven Coons, Ivan Sutherland, and Timothy Johnson started working with the TX-2 computer system to manipulate the drawn pictures.1959: The first commercial film recorder was produced in San Diego, CA.
- Don Hart and Ed Jacks invented the first computer-aided drawing system at General Motors Research Laboratory and IBM.
- 1960: William Fetter was first termed “Computer Graphics” for cockpit drawing. John Whitney Sr. invents motion graphics in LA.
- 1962: At MIT Lincoln Laboratory Ivan Sutherland produced a man-machine graphical communication system.
- Contd:
- 1995: First, fully CGI (Computer-generated imagery) was released. MS Internet Explorer 1.0 released.
- 2000: The first web-based CAD system Sketch was released.
- 2006: Google acquires Sketch.
- 2009: The state of the art of computer graphics, as of 2009, was brief in a short video.
- 2013: Now, it is possible to create graphics on a home computer. 2015: Big data is being used to create animations.
- 2018: Now, we can create “realistic” graphics on mobile phones. We can also create a completely CGI-based human face in real time.
Introduction to Computer Graphics (CG):
The computer is an information processing machine. It is a tool for storing, manipulating, and correlating data. There are many ways to communicate the processed information to the user. There are virtually no areas in which graphical display cannot be used for some advantages. Advances in computer technology have made interactive computer graphics a practical tool as Visual presentations of data.
“Computer Graphics is a branch of science which studies the manipulation of visual and geometric information using computation techniques.” It displays the information in the form of graphics objects such as pictures, charts, graphs, and diagrams instead of simple text. Thus CG makes it possible to express data in pictorial form. The picture or graphics object may be an engineering drawing, business graph, architectural structure, single frame from animated movies, or machine parts illustrated for a service manual.
Relationship between computer Graphics and Image Processing:
In general Computer graphics is all about Synthesizing (producing) a new image from Geometry, Lighting parameters, materials, and textures. The emphasis is on digital image production.
Whereas Image Processing can be defined as a technique of modifying the already existing pictures which include TV scans and photographs.
Advantages of Computer Graphics:
- Better communication: A high-quality graphics display of a personal computer provides one of the most natural means of communicating with a computer. There are great advantages to communicating through pictures rather than text.” A picture is worth a thousand words.”
- It has the ability to show moving pictures, and thus it is possible to produce animations with computer graphics.
- Computer graphics used can also control the animation by adjusting the speed, the portion of the total scene in view, the geometric relationship of the objects in the scene to one another, the amount of detail shown, and so on.
- Computer graphics also provides a facility called update dynamics. With updated dynamics, it is possible to change the shape, color, or other properties of the objects being viewed.
- With the recent development of digital signal processing (DSP) and audio synthesis chip, interactive graphics can now provide audio feedback along with graphical feedback to make the simulated environment even more realistic.
Applications of Computer Graphics:
Computer graphics is useful in almost all part of our life. Some of the popular areas of computer graphics are:
- Computer-Aided Design(CAD)
- Graphical User Interface(GUI)
- Education and Training
- Entertainment
- Presentation Graphics
- Computer Art
- Visualization
- Image Processing
- Medicine
Co mputer-Aided Design (CAD):
A major use of CG is in design processes, particularly for engineering and Architectural system. CAD is the use of computer technology to aid in the design and drawing of parts or products. CAD is mainly used for detailed engineering of 3D models and 1D and 2D drawings of physical components however it is being used in the engineering process from conceptual design and layout of products. CAD has become a key technology within the scope of Computer Aided technology with benefits such as lower product development cost and greatly short time duration. CAD is being used in many areas like Architecture, Interior design, building engineering, civil engineering, construction, mechanical engineering, Industrial design, product design, etc.
Graphical User Interface (GUI):
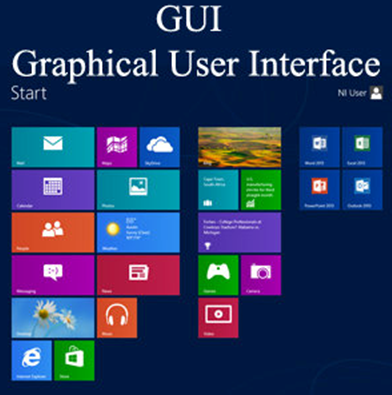
GUI is the type of user interface that allows people to interact with a system mostly electronic devices like computers, handheld devices, household appliances, and office equipment. Almost all software package now comes with a GUI through which we can use it. Typical components of GUI are menus, cursor, scrollbars, buttons, and Icons which provide a user-friendly environment to the user in a system. CUI (command user interface) based software was very difficult to operate than GUI-based software. Not only with software packages but GUI comes with lots of other kinds of devices like television, operating and using mobile phones, and ATMs (Automatic Teller Machines).

Education and Training:
Earlier Education and training were rendered using pen, pencil/paper, or chalkboard style of teaching. Nowadays, with the help of CG computer generated models of physical, financial, mathematical, and economic systems are often used as educational aids. CG can be used to design images, and videos through which education or training can be given in a graphical form which makes interactive teaching and learning process. For eg: Instead of a textbook diagram of the human body, if an animated model could be shown on the screen with various activities of the body depicted in the form of moving objects, then students can learn the functionality of the human body in a better way.

Entertainment:
CG can be commonly seen in motion pictures, motion videos, computer games, and commercial advertisements. Now, the world has been attracted by computer Animation, special effects, and photorealistic imagery of virtual environments. CG is used in motion pictures, music videos, television shows, cartoon animation films, etc. From Jurassic Park, Ice Age, Bal Ganesh, etc, and dancing soda cans in tv commercials computer-generated graphics have greatly influenced the entertainment industries. Computer and video games are another application of CG.
Presentation Graphics:
Another use of CG is in presentation graphics, used to produce illustrations for reports, facts, and figures that can be easy to interpret and analyze. These are commonly used to summarize financial, statistical, mathematical, scientific, and economic reports or data for information delivery and analysis. Typical examples of presentation graphics are bar charts, line graphs, surface graphs, pie charts, and other displays showing relationships between multiple parameters. One of the popular presentation graphics used in business areas is Microsoft PowerPoint.
Computer Art:
Computer graphics techniques and methods are commonly used in both fine arts and commercial art applications. These days logos, marriage cards, posters, visiting cards, book designing, and advertisements are all designed on the computer itself. Even a newspaper is also designed on a computer. Artists are using graphics applications to design cartoon characters and paint pictures using pen brush tools on the screen. There is no need to throw away a design if even a small mistake is made on it and create a new one by undoing it. Paintbrush, Adobe Photoshop, Photo-Paint, Illustrator, CorelDraw, etc are examples of computer art applications.
Medicine:
Nowadays the results of most of the medical tests can be seen on the computer screen itself for better visualization and diagnostics. Graphics techniques can be used in medicine to model and study physical functions, plan and practice surgery, patient-monitoring activities, design artificial limbs (joins), etc. A number of graphical screens can be seen in the Intensive Care Unit (ICU) of hospitals.
Image Processing:
Image processing can be defined as a technique of modifying the already existing pictures which include TV scans and photographs. The processing of an image basically means improvement of the image in its appearance and the efficient representation of the image. Two principal applications of Image processing are improving picture quality and machine perception of visual information (used in robotics) of an already existing image. These techniques are extensively used in commercial arts, medical applications such as X-ray photography, plan, and practice surgery, multimedia and video editing, etc.
Visualization:

The analysis of large amounts of information to study the behavior of certain processes using CG applications and methods by scientists, engineering, and business analysts, the effort to be spent on these activities has been reduced to a great extent. If this huge amount of data can be converted into visual form, then graphics applications are available that can be analyzed easily and effectively. For eg: Census results and trends can be analyzed and displayed graphically using computer applications. Similarly, Business visualization tools, scientific visualization tools, weather forecasts tools, earthquake alarm systems, etc. are used for visualization.